
Environment
Water resources and waste
In 2024, WNC issued a Water Resources Management Policy, aiming to achieve its water management objectives through water use monitoring and the implementation of water recycling initiatives, while carrying out internal and external audits to ensure compliance with ISO 14001 standards.
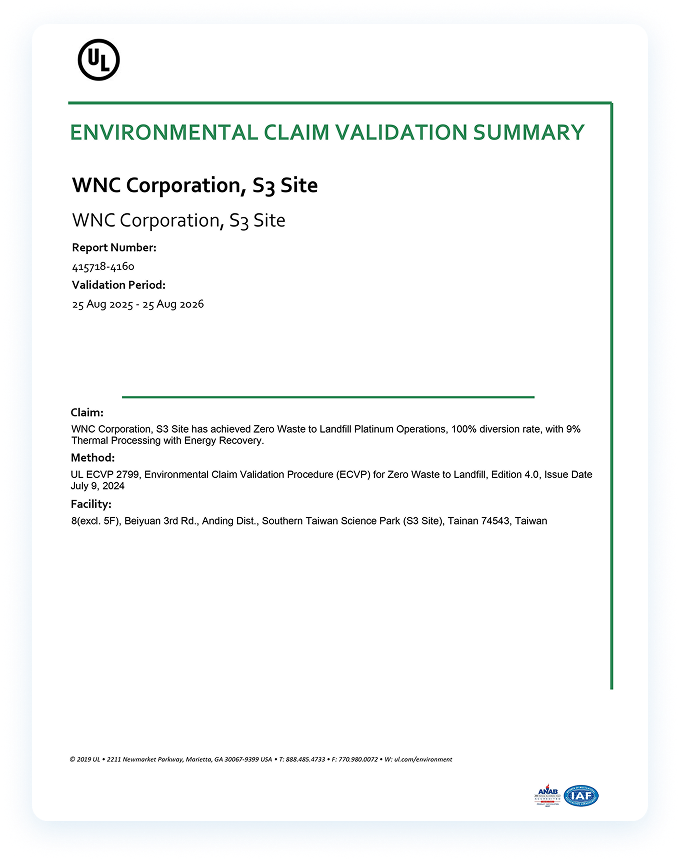
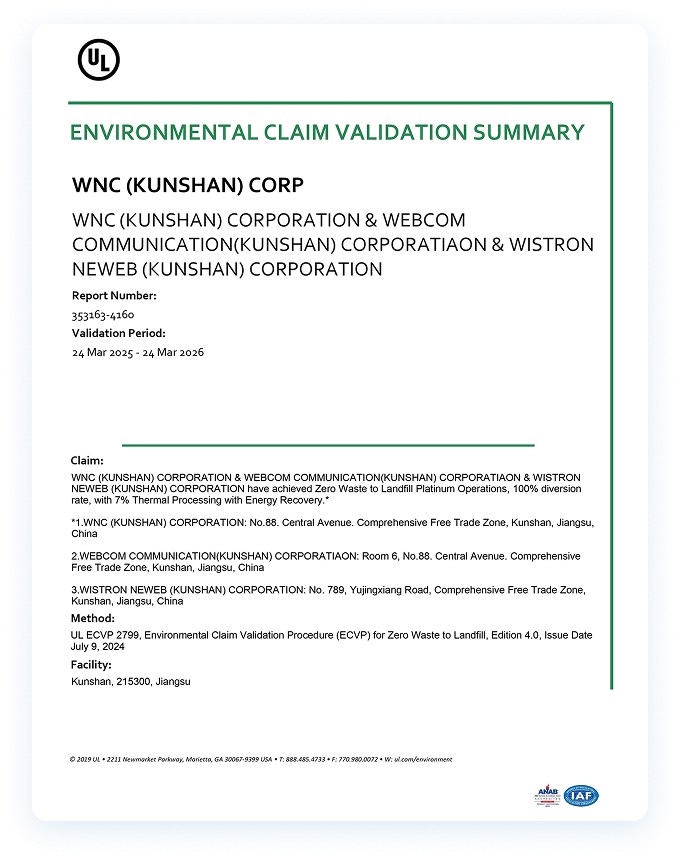
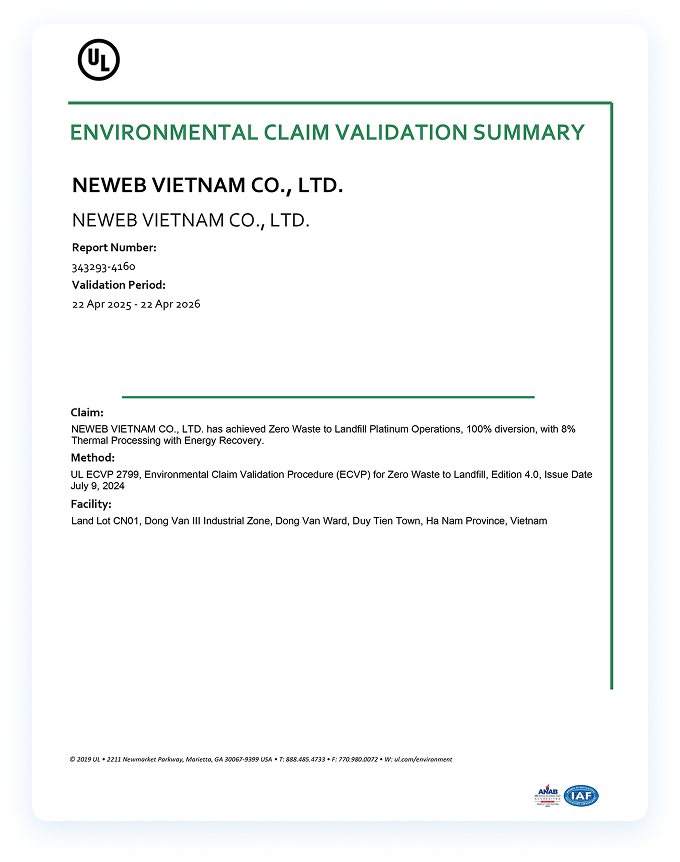
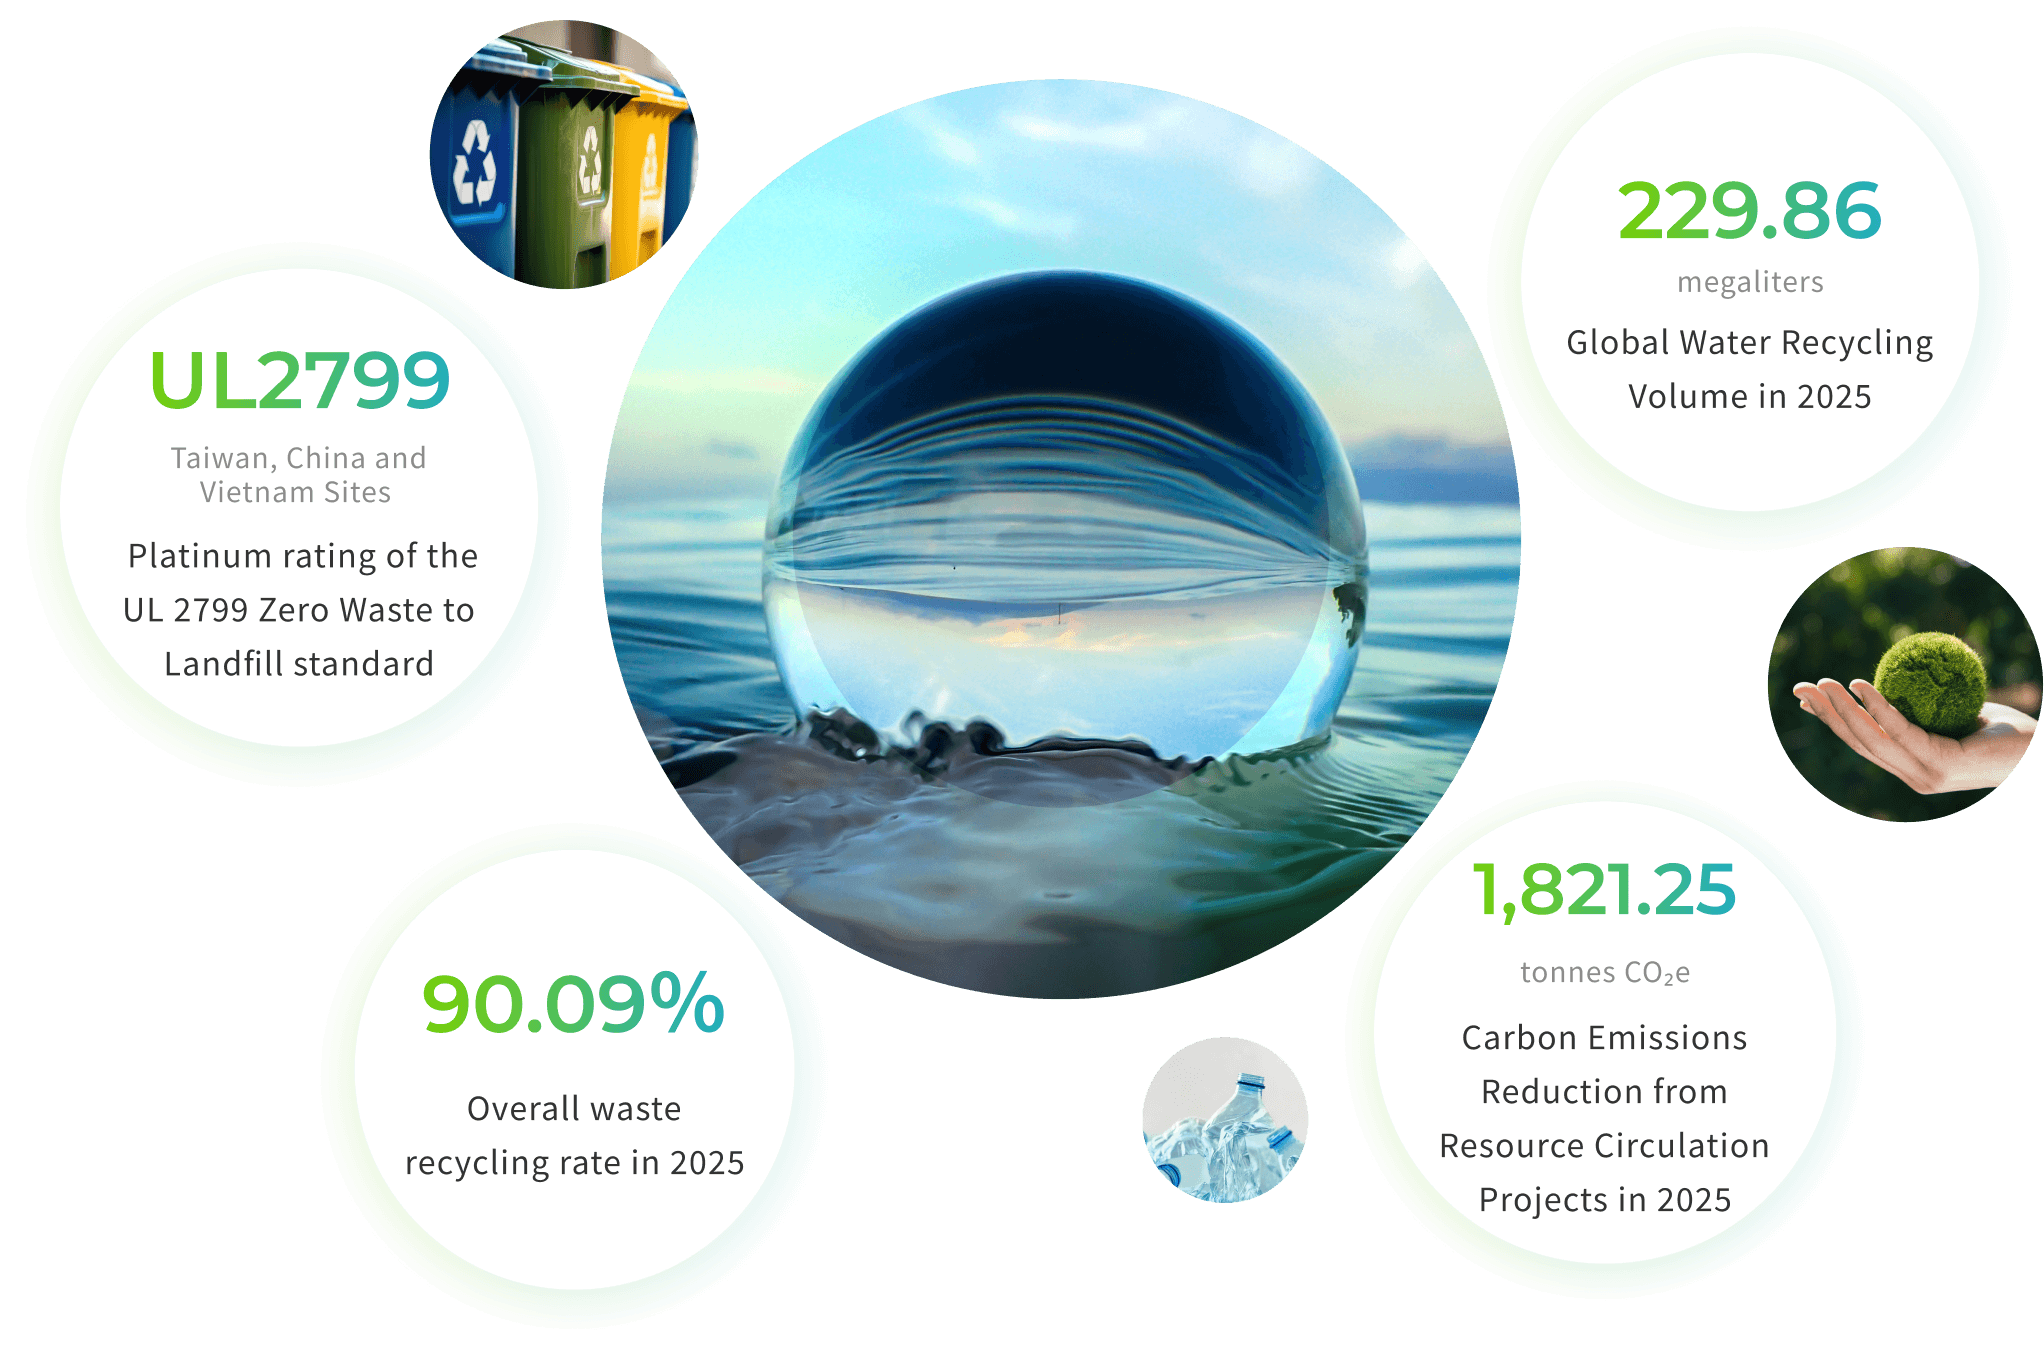
- 台灣、中國、越南據點 UL2799 廢棄物零填埋鉑金級認證
- 2025 年整體廢棄物回收率 90.09%
- 2025 年資源循環專案可減少碳排放 1,821.25公噸 CO₂e
- 2025 年全球回收水量 229.86 百萬公升
Risks and opportunities management
WNC's TCFD working group references emerging domestic and international industry issues and global trends to conduct a comprehensive risk assessment every three years to ensure the relevance and effectiveness of risk management. The company has adopted Aqueduct 4.0, a tool launched in 2023 by the World Resources Institute (WRI), to analyze water risk. The tool integrates climate models from international organizations (such as CMIP6), hydrological models (such as PCR-GLOBWB, HYPE), and surface and groundwater data, transforming the aforementioned models and data into water risk indicators. We analyzed water risk at a total of 1,755 sites worldwide, 16 of which are our sites (owned or leased) and 1,739 of which are supplier sites. Our sites are located in China, Japan, Taiwan, Vietnam, the United Kingdom, Germany, Mexico, and the United States. Supplier sites are located in all continents besides Antarctica.
Water-related risks
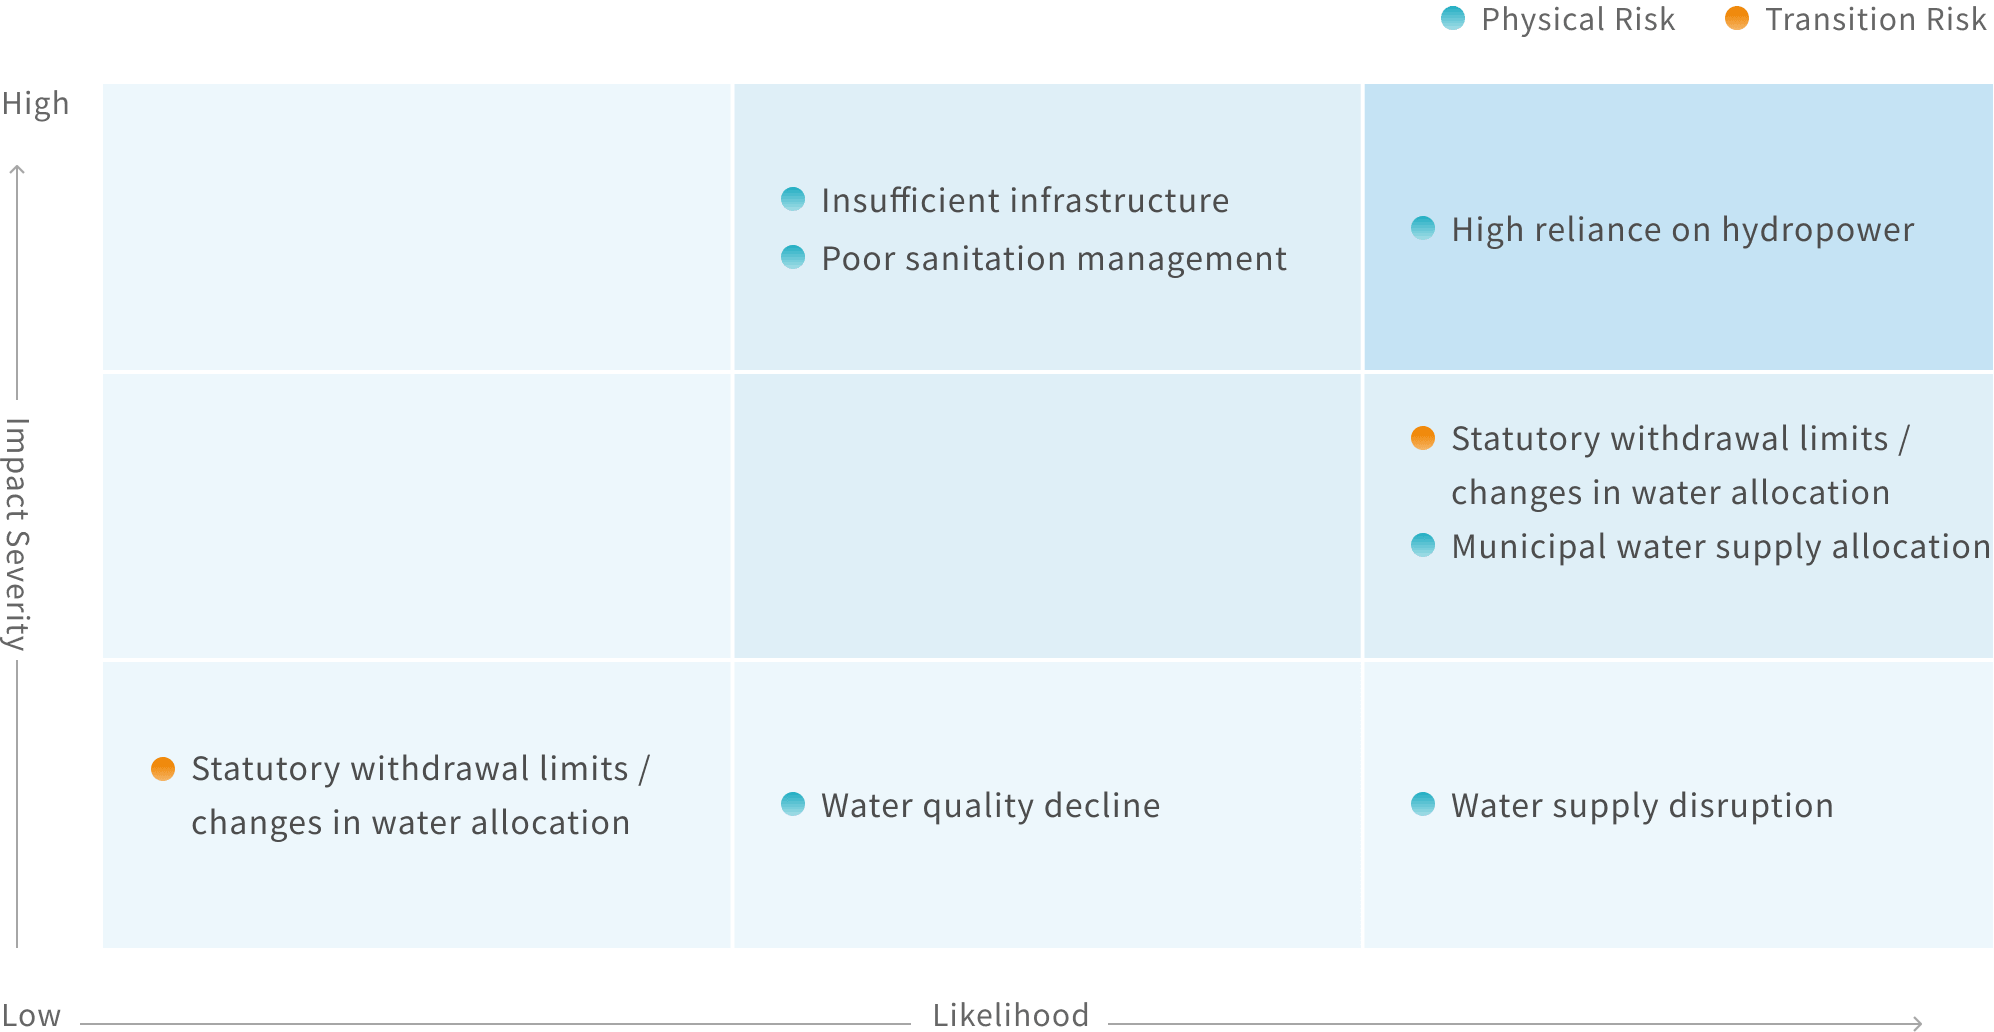
Water-related risks materiality ranking
Materiality ranking | TOP1 | TOP2 | TOP3 | TOP4 | TOP5 |
|---|---|---|---|---|---|
Topic | Highly reliant on hydroelectric power | Insufficient infrastructure | Changes in legal water withdrawal limits / water allocation | Municipal water supply allocation | Poor hygiene management |
Risk type | Physical, long-term | Physical, long-term | Transformation, regulations | Physical, long-term | Physical, long-term |
Water-related opportunties
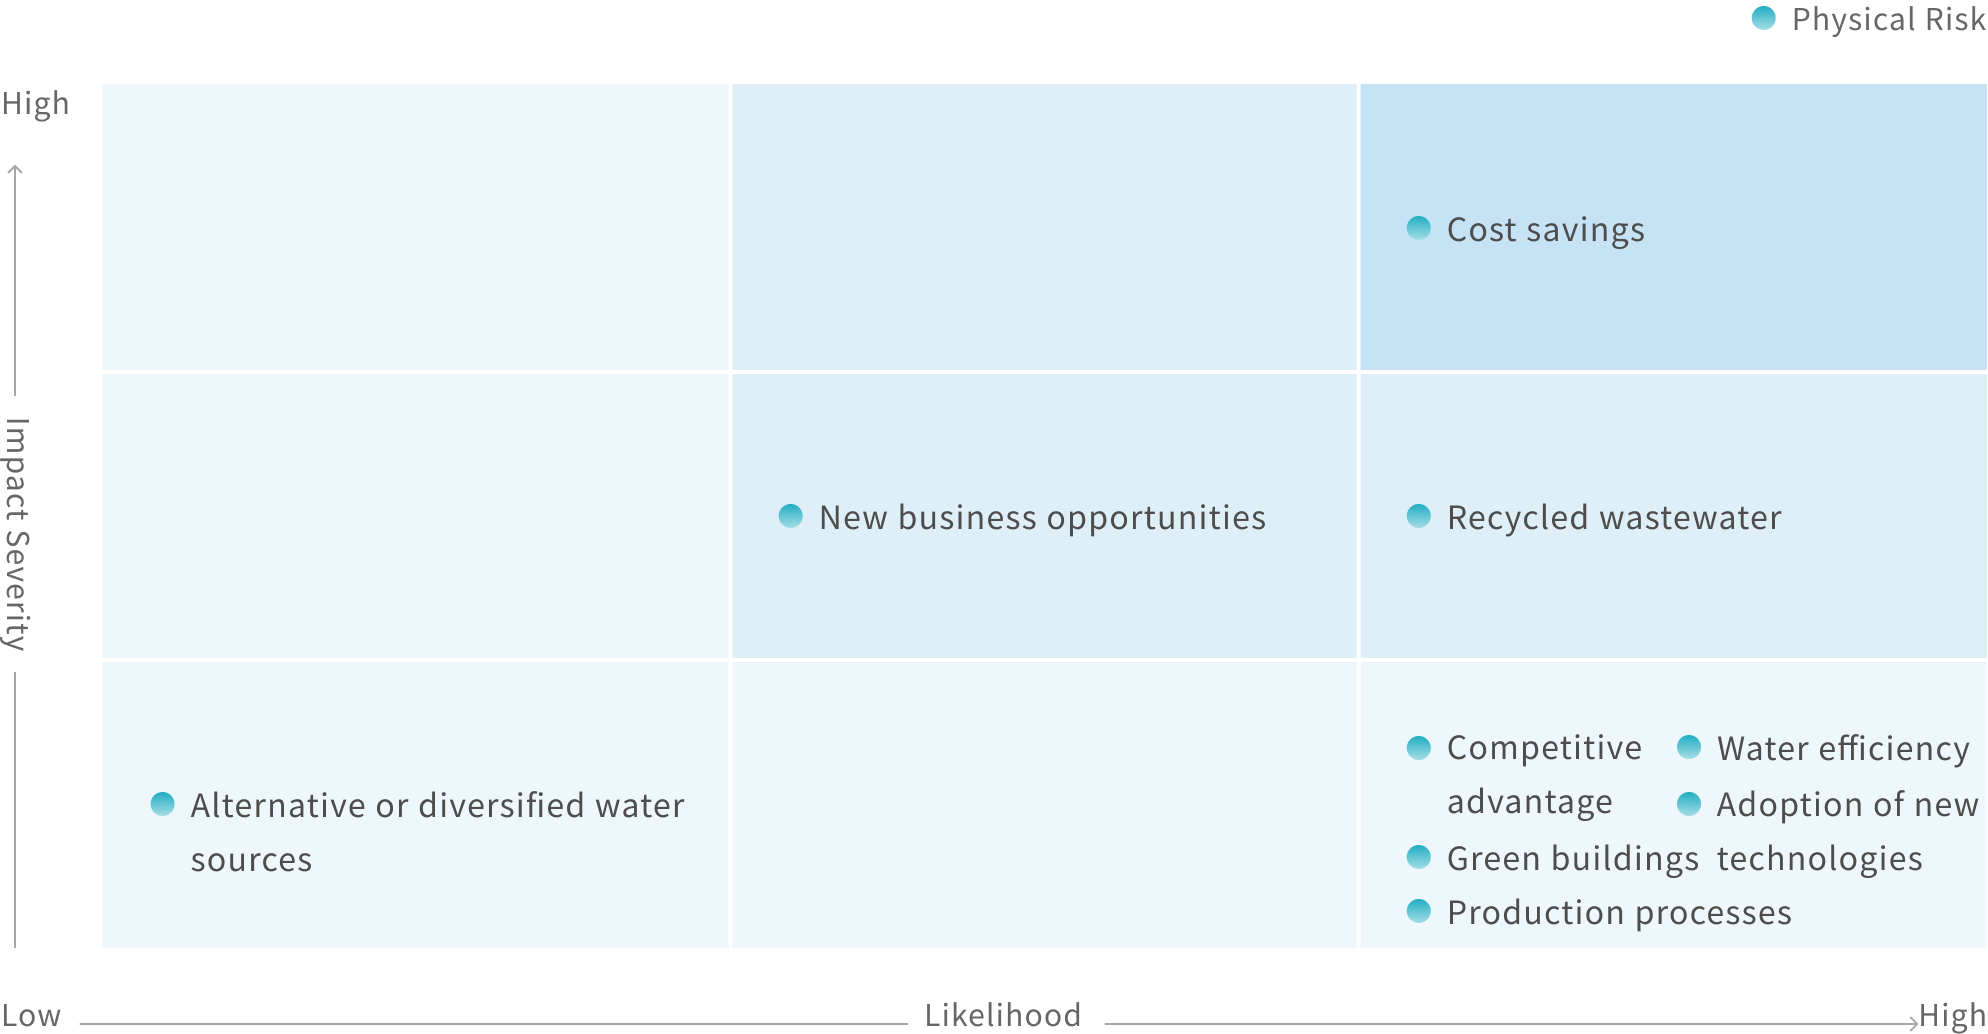
Water-related opportunties materiality ranking
Materiality ranking | TOP1 | TOP2 | TOP3 |
|---|---|---|---|
Topic | Reduce costs | Recycled water | Emerging business opportunities |
Risk type | Water resources use efficiency | Water resources use efficiency | Market |
Water resources overview
In 2025, total water withdrawal was 784.58 megaliters, total water discharge was 641.84 megaliters, and total annual water consumption was 142.74 megaliters. The main reason for the increases was the inclusion of water usage statistics for the Mexico site and the dormitories at China sites. China and Mexico are located in high water-stress areas. Water withdrawal at WNC sites in these areas totaled 309.51 megaliters, accounting for 39.45% of total water withdrawal, while water consumption totaled 47.73 megaliters, accounting for 33.44% of total water consumption. In terms of water use efficiency, water withdrawal intensity in 2025 was 5.58 cubic meters per NT$ million of revenue, representing an increase compared with 2024. This was mainly due to the expansion of the Vietnam site as well as increased water demand for certain manufacturing processes.
Note WNC’s water withdrawal statistics are primarily based on tap water. Water withdrawal data from 2022 to 2024 has been restated this year, and data on recovered rainwater and air-conditioning condensate has been excluded.
Note The Hsinchu Science Park Sewerage User Fee Charging Standards issued by the Hsinchu Science Park Bureau of the National Science and Technology Council are used as the basis for calculating wastewater discharge at WNC sites in Taiwan, Vietnam, and Mexico. For China sites, calculations follow the Handbook of Accounting Methods and Coefficients for Pollutant Generation and Discharge from Emission Sources issued by China’s Ministry of Ecology and Environment.
Note Water withdrawal intensity is calculated based on numbers from major production sites, and does not include the Mexico site and on-site dormitories. The formula is: Water withdrawal volume (cubic meters) / revenue (NT$ million).
Water conservation results
WNC’s manufacturing sites strictly comply with local water use standards. Through water balance mapping and taking inventories of water usage, each site is able to precisely track the flow of water resources and improve water use efficiency. WNC’s S1 site has launched a two-year water conservation project: In 2024, the first phase of a reclaimed water pretreatment system and RO membrane system installation was completed. Phase two of this project began in 2025 and was focused on recycling wastewater produced during manufacturing processes. The systems built in phase two will be able to recycle an additional 14.6 megaliters of water annually. Smart sensing water meters have already been installed at WNC sites in China, while smart water meters have been installed at key water intake points, high-consumption hotspots, and reclaimed water nodes in the Vietnam site. Relevant data has also been integrated into the Energy Management System (EMS) to enable digital monitoring and hotspot analysis of water usage and reclaimed water volume. In 2025, the total volume of water recycled by WNC sites reached 229.86 megaliters. The formal inclusion of the Mexico site within the reporting boundary led to a temporary fluctuation in the overall water recycling rate. Going forward, the focus will be on improving local smart monitoring infrastructure and water resource management.
Amount of water recycled at WNC in the most recent four yearsNote 1 (Unit: megaliters)
| Item | 2022 | 2023 | 2024 | 2025 |
|---|---|---|---|---|
| Tap water | 17.41 | 36.42 | 24.58 | 67.24 |
| Groundwater | 0 | 0 | 0 | 0 |
| Surface water | 3.83 | 31.10 | 49.92 | 37.86 |
| Other | 51.33 | 109.24 | 127.72 | 124.75 |
| Total water recycled | 72.58 | 176.76 | 202.22 | 229.86 |
| Water recycling rateNote 2 (%) | 14.45 | 30.24 | 37.31 | 29.30 |
Note1 Tap water recycling includes drinking fountain RO wastewater recycling and water recycled from production processes. Surface water recycling includes the recovery of air-conditioning condensate and rainwater. Recycling from other water sources includes the recovery of cooling tower blowdown based on conductivity control.
Nore2 Water recycling rate is calculated by dividing the total volume of water recycled by the total water usage (tap water + groundwater + surface water).
Waste management

WNC's waste sources primarily include raw materials used in production (such as electronic parts, mechanical parts, and packaging materials), wood, plastics and paper generated during production and transportation processes. To promote resource circulation and reduce the environmental impact of company operations, WNC is using green product design to reduce the amount of waste generated. It is also working with supply chain partners to promote the recycling of packaging materials and optimize resource classification management procedures to improve resource reuse rates. In addition, WNC works with authorized waste treatment and recycling vendors to expand waste reuse channels and achieve effective waste reduction.
In order to comply with the ISO 14001 standards, WNC has set up waste management indicators at each site, and manages and tracks waste through an environmental data platform. When an indicator deviates from its target, the composition and sources of waste related to said indicator are promptly analyzed to identify opportunities to improve resource circulation and investigate any abnormalities. Measures related to circular economy management measures are also implemented when appropriate. In 2025, WNC’s industrial waste was primarily transported off-site for treatment and disposal. After adding the numbers for the Mexico site, the total amount of industrial waste generated by WNC in 2025 was 8,314.34 tonnes, which comes to an annual waste disposal intensity of 0.006 tonnes per million NTD. These numbers marked a cumulative reduction rate of 56.57% compared with the 2021 base year, exceeding the annual target of 50%. WNC’s overall waste recycling rate in 2025 also increased to 90.09%, demonstrating the company’s sound implementation of resource circulation and waste management amid the expansion of its global operations.
Waste management performance in the most recent four years
| Type | Unit | 2022 | 2023 | 2024 | 2025 |
|---|---|---|---|---|---|
| Disposal waste intensityNote 1 | tonnes/NT$ million | 0.010 | 0.008 | 0.007 | 0.006 |
| Year-over-year reduction in disposal waste intensityNote 2 Base year: 2021 | % | 20.03% | 41.90% | 46.46% | 56.57% |
| Waste recycling rateNote 3 | % | 83.62% | 87.30% | 88.75% | 90.09% |
Note1 Disposal waste generation intensity is calculated by dividing the total amount of waste disposed of by the consolidated annual revenue. The scope primarily covers manufacturing sites in Taiwan, China, and Vietnam.
Note2 Year-over-year reduction in disposal waste intensity = total amount of disposal waste generated in the current year (tonnes) divided by consolidated annual revenue for the current year (NT$ million).
Note3 The waste recycling rate covers manufacturing sites in Taiwan, China, Vietnam, and Mexico.
Note4 Waste recycling rate is calculated by dividing the amount of waste recycled by the total waste generated; the definition of recyclable waste is based on the local regulations where sites are located.
Waste generated in the most recent four years and relevant handling methodsNote
| Type | 2022 | 2023 | 2024 | 2025 | |||||||||
|---|---|---|---|---|---|---|---|---|---|---|---|---|---|
| General waste | Hazardous waste | Total | General waste | Hazardous waste | Total | General waste | Hazardous waste | Total | General waste | Hazardous waste | Total | ||
| Waste recycling | Reuse, recycling and reuse, other recycling methods | 4,899.55 | 177.92 | 5,077.47 | 5,463.94 | 310.52 | 5,774.46 | 5,799.95 | 278.11 | 6,078.07 | 7323.98 | 166.10 | 7,490.08 |
| Waste disposal | Landfill | 0 | 0 | 0 | 0 | 0 | 0 | 0 | 0 | 0 | 173.20 | 46.12 | 219.32 |
| Incineration (with energy recovery) | 112.51 | 0 | 112.51 | 636.79 | 16.44 | 653.24 | 680.40 | 70.42 | 750.82 | 492.00 | 32.97 | 524.97 | |
| Incineration (without energy recovery) | 766.78 | 108.56 | 875.34 | 121.65 | 65.46 | 187.11 | 6.97 | 8.24 | 15.21 | 39.94 | 0.03 | 39.97 | |
| Other disposal methodsNote | 0 | 6.69 | 6.69 | 0 | 0 | 0 | 0 | 4.33 | 4.33 | 13.50 | 26.50 | 40.00 | |
| Total disposal (excluding recycling) | 5,778.84 | 293.17 | 6,072.01 | 6,222.38 | 392.42 | 6,614.81 | 6,487.32 | 361.11 | 6,848.43 | 8,042.62 | 271.72 | 8,314.34 | |
NoteOther Primarily consists of chemical treatment of laboratory waste liquids in Taiwan and organic waste in Mexico, both of which
are entrusted to qualified third-party contractors for safe disposal in compliance with local environmental regulations.
Waste reduction hotspots analysis and resource recycling project
WNC regularly tracks and manages the waste output structure and improves waste raw material removal methods. In terms of process waste, WNC continues to promote off-site reuse plans for solder dross, solder paste plastic containers, epoxy resin, and printed circuit board metal scraps. For packaging materials and containers, such as plastic trays, outer packaging cardboard boxes and Styrofoam boxes, the company negotiates with suppliers to promote reuse and is gradually expanding the scope of negotiations.
For production consumables and test equipment, systematic usage and waste management has been implemented. In addition, inspection and maintenance processes have been added to extend the lifespan of consumables. When recycling metals, the company classifies them by their value (precious metals, general metals) to create higher recycling benefits. For waste materials that cannot be reused, such as electrostatic bags and ESD garments, WNC has introduced a conversion mechanism that converts waste heat into energy, further improving the waste recycling rate. In 2025, about 5,092.02 tonnes of recycled resources were obtained through resource recycling projects, and recycling revenue reached NT$34.01 million. It is estimated that this can reduce emissions by approximately 1,821.25 tonnes CO2e in the value chain.
| Type | Total | ||
|---|---|---|---|
| Recycled/saved amount (tonnes) | Recycling/conservation benefits (NT$10,000) | Carbon reduction effects (tonnes CO2e) | |
| Solder waste recycling and reuse | 29.63 | 1,752.62 | 10.67 |
| PCB trim scraps recycling and reuse | 206.78 | 952.01 | 74.44 |
| Used pallets recycling and reuse | 882.70 | 190 | 317.77 |
| Empty solvent barrels and solder paste plastic containers recycling and reuse | 6.87 | - | 2.47 |
| Waste paper and waste cardboard boxes | 3,537.44 | 428.85 | 1,273.48 |
| Plastic trays recycling | 225.77 | 251.74 | 81.28 |
| Scrap Styrofoam recycling | 0.17 | - | 0.06 |
| Waste activated carbon | 98.68 | - | 35.52 |
| Epoxy resin | - | - | - |
| Others | 70.99 | 16.36 | 25.56 |
| Subtotal | 5,059.02 | 3,401.59 | 1,821.25 |
Air pollution control
Currently, WNC's main emission sources of air pollutants are volatile organic compounds (VOCs), such as flux and cleaning agents used in production processes. Although WNC was not subject to regulatory control under the Taiwan’s Air Pollution Control Act from 2021 to 2023, the company still voluntarily disclosed its stationary source emissions data based on monitoring results. Due to increased production capacity at the S1 site, the company installed air pollution control equipment at the site and secured a Stationary Pollution Source Operating Permit in the same year, enabling it to better manage VOCs generated during production processes. In 2025, the company continued to reduce the use of VOCs to mitigate the environmental impact of our production processes. In the same year, total air pollutant emissions across WNC’s seven major sites reached 14.31 tonnes. Of this total, VOCs accounted for 13.69 tonnes, representing 94.96% of air pollutant emissions.
Featured case of the year
Highlight
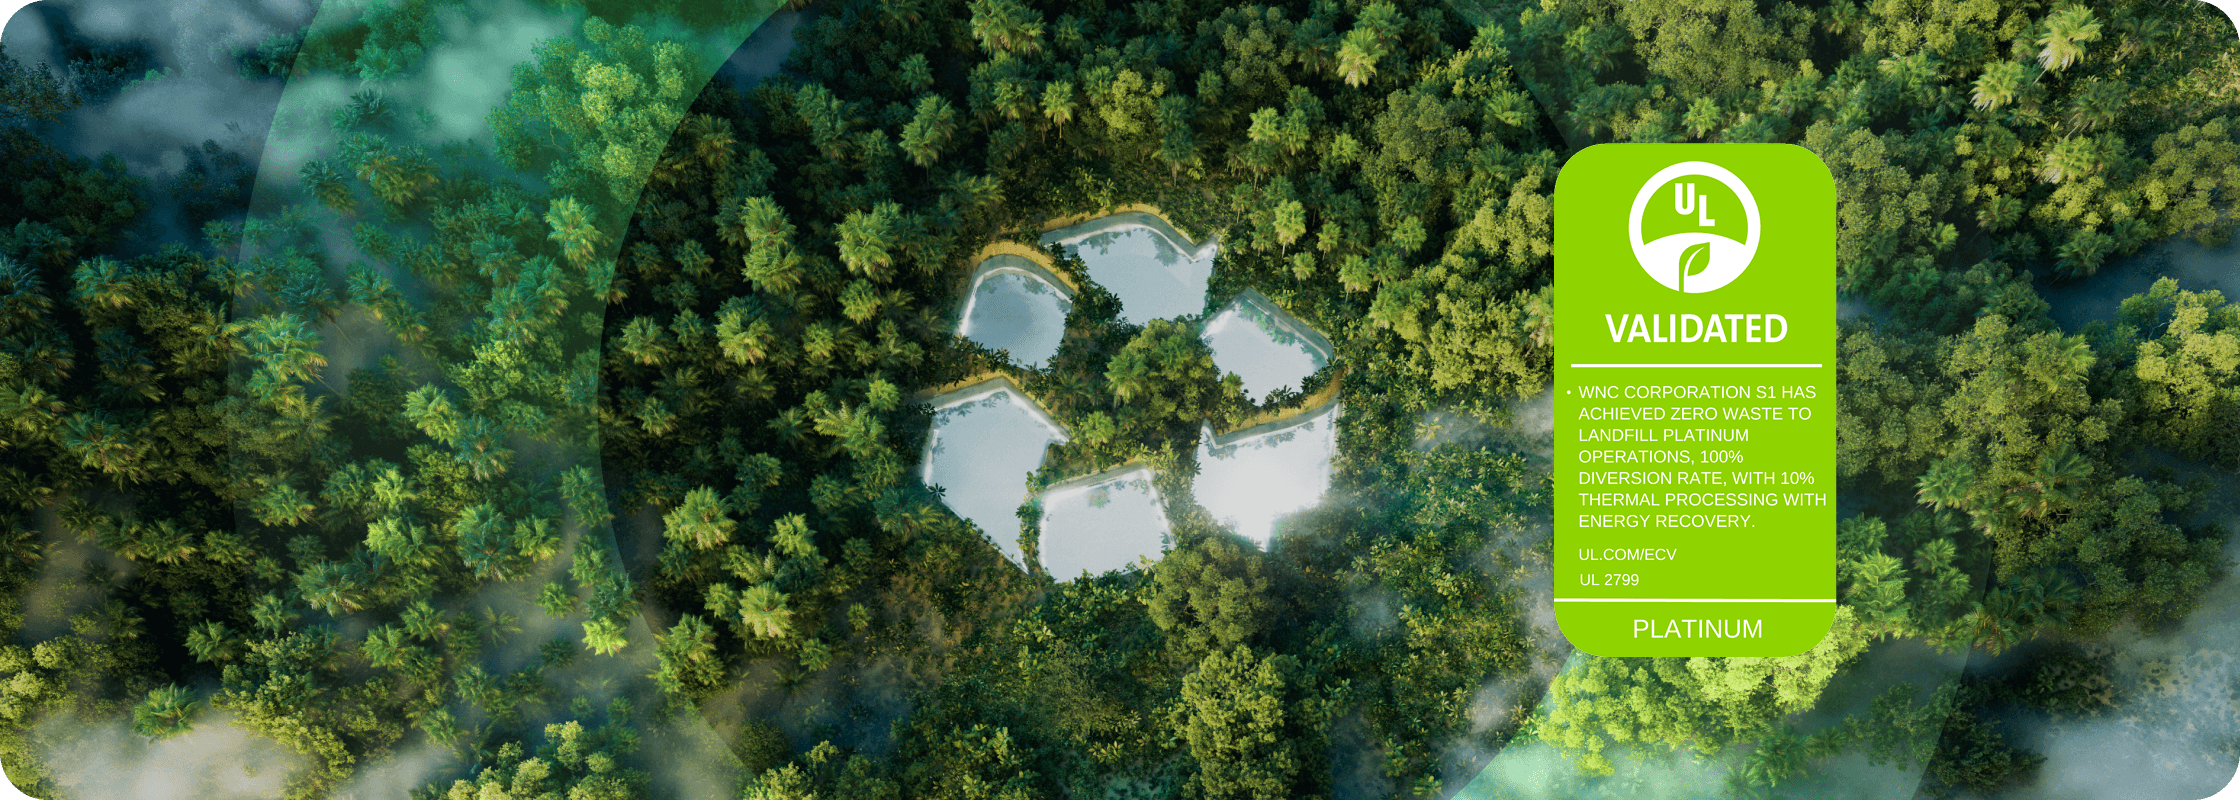
Three WNC sites obtained UL 2799 platinum rating in 2025
Resource circulation and environmental sustainability are key areas of focus for WNC. In 2025, the company’s Kunshan, Vietnam, and S3 sites earned the highest platinum rating of the UL 2799 Zero Waste to Landfill standard. This signifies that the company has reached a 100% waste diversion rate, showcasing its excellence in resource management.
The S3 site has established a benchmark for waste governance through measures such as source reduction, precise categorization, and process optimization. The Kunshan and Vietnam sites demonstrated the consistency of WNC’s waste management strategy, as both sites used the most stringent international standards to monitor waste generation, categorization, and reuse.
UL 2799 requires companies to accurately track and document waste streams. WNC secured this validation through source reduction, waste hierarchy management, data transparency, and prioritizing material reuse and recycling. After the aforementioned three sites obtained the UL 2799 platinum rating, WNC’s S1 site in Taiwan also obtained the same rating in January 2026. With this cross-regional network of sites with green validations/certifications. WNC has taken another step towards achieving zero waste and minimizing its negative impact on the environment.