

Sustainability Strategy
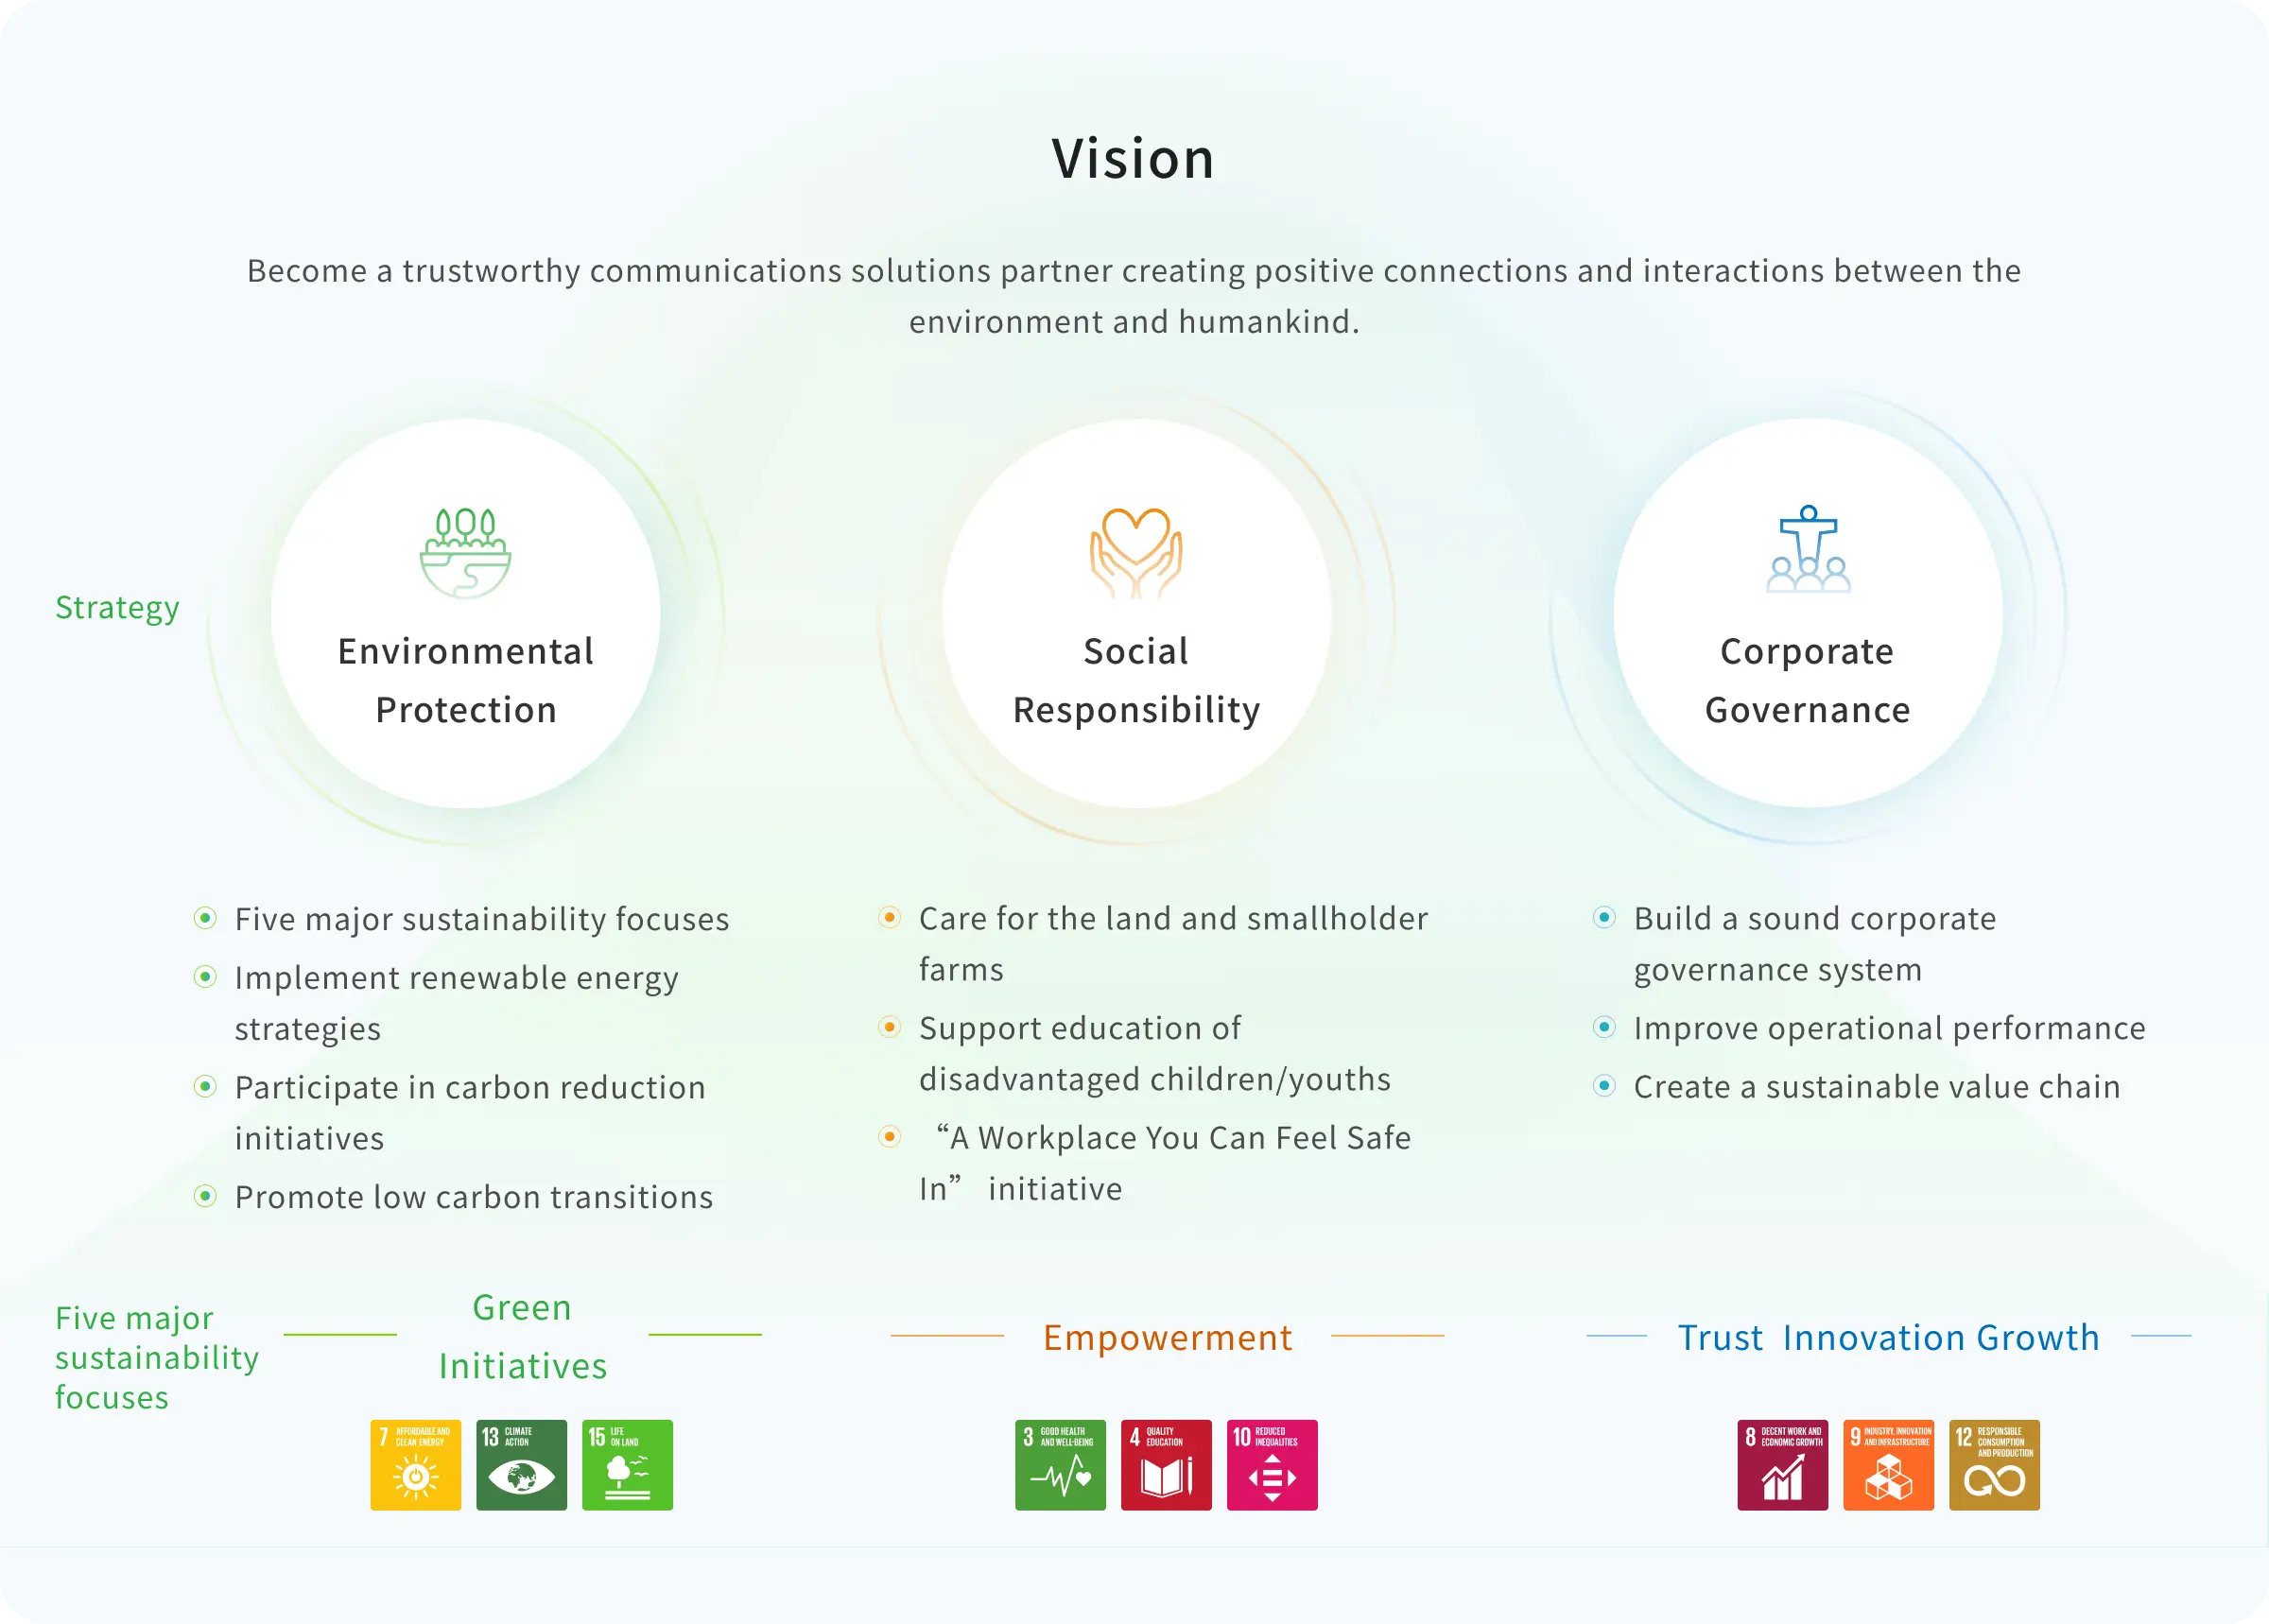
In alignment with UN’s Sustainable Development Goals (SDGs), WNC has drawn up a sustainable development strategy to serve as overall guiding principles. This strategy encompasses three main aspects: environmental protection, social responsibility and corporate governance. In addition, the company’s five major sustainability focuses are: green initiatives, empowerment, trust, innovation, and growth. With these principles, WNC collaborates and communicates with key stakeholders to pursue business development and sustainability.
Vision
Become a trustworthy communications solutions partner creating positive connections and interactions between the environment and humankind.
Strategy
Environmental Protection
- Adopt green product design concepts
- Implement renewable energy strategies
- Participate in carbon reduction initiatives
- Promote low carbon transitions
Social Responsibility
- Care for the land and smallholder farms
- Support education of disadvantaged children/youths
- “A Workplace You Can Feel Safe In” initiative
Corporate Governance
- Build a sound corporate governance system
- Improve operational performance
- Create a sustainable value chain
Five major sustainability focuses
Green Initiatives
- SDGs 7 Affordable and Clean Energy
- SDGs 13 Climate Action
- SDGs 15 Life on Land
Empowerment
- SDGs 3 Good Health and Well-being
- SDGs 4 Quality Education
- SDGs 10 Reduced Inequalities
Trust Innovation Growth
- SDGs 8 Decent Work and Economic Growth
- SDGs 9 Industry, Innovation and Infrastructure
- SDGs 12 Responsible Consumption and Production
Sustainability Governance
Sustainable Development Committee operations
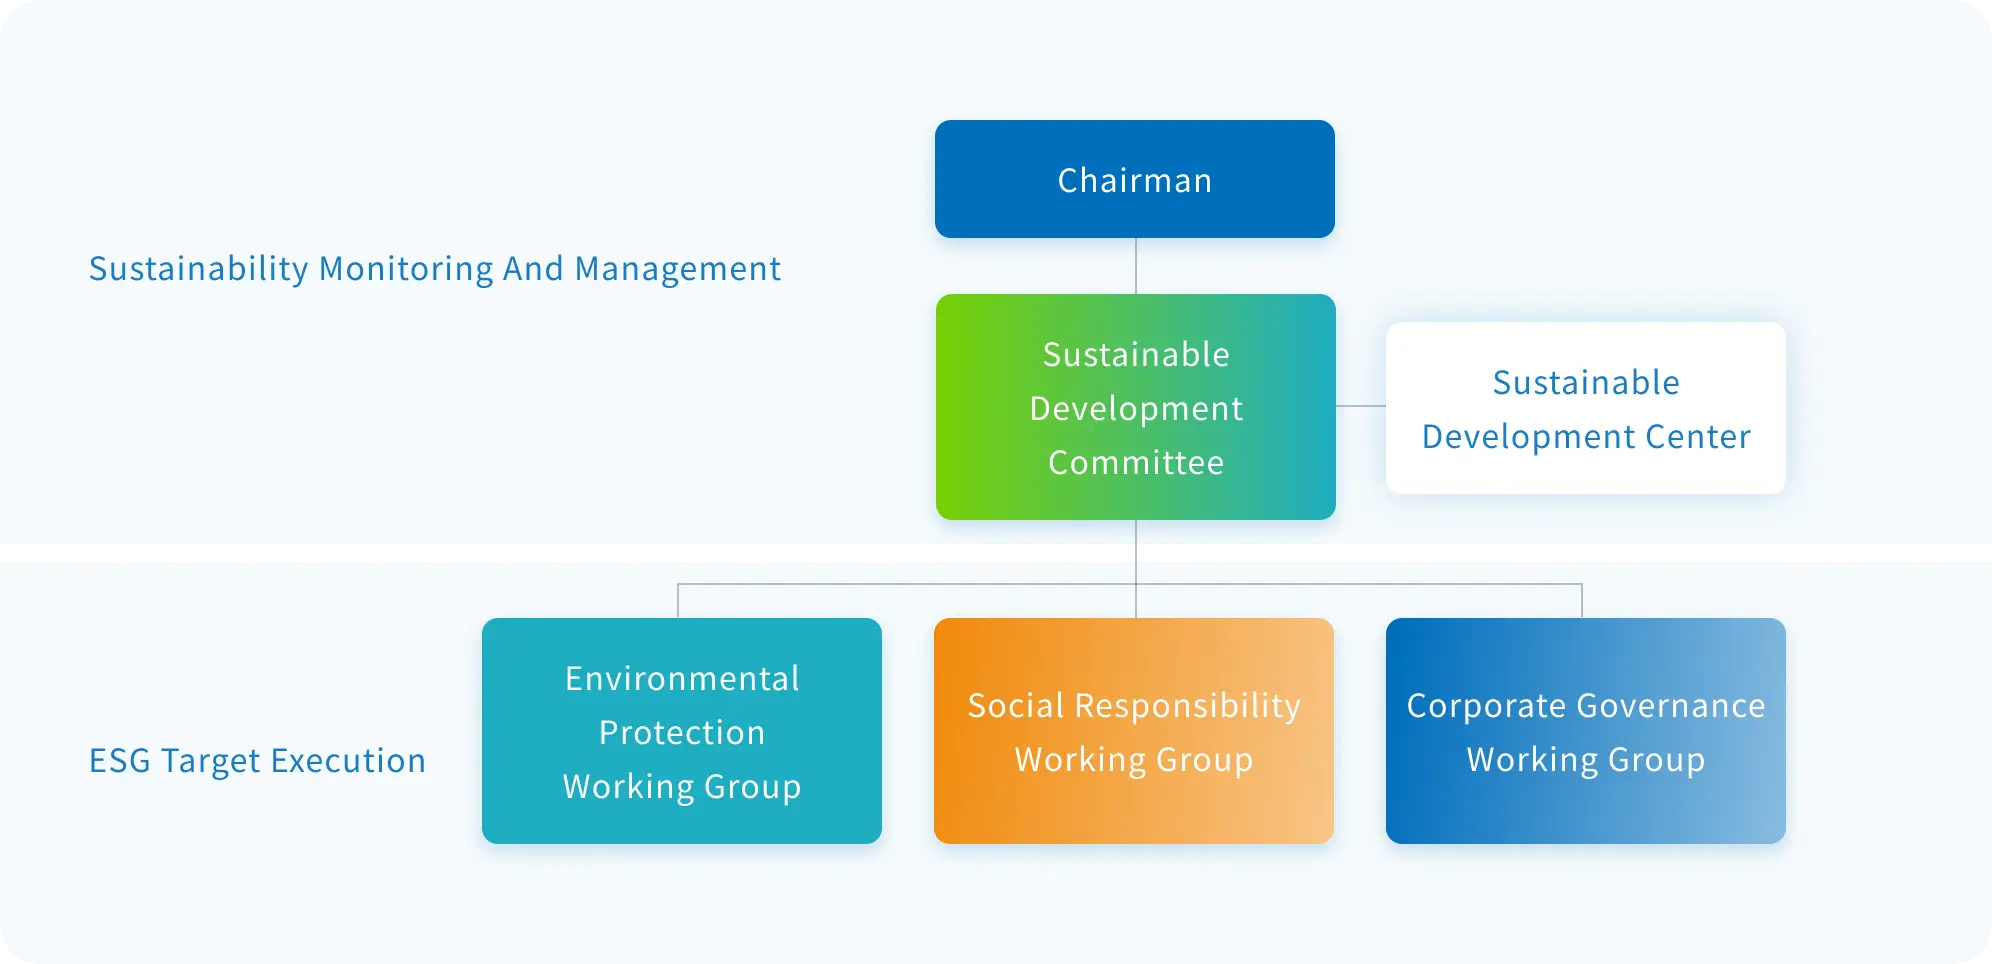
To comply with and implement its Sustainable Development Policy, WNC established a Sustainable Development Committee in 2024, following approval by the BOD. Serving as a cross-unit platform, the Committee drives vertical and horizontal collaboration and oversees three primary working groups. In accordance with the Financial Supervisory Commission’s requirement for internal sustainability information management measures, WNC has implemented internal management mechanisms and incorporated them into its annual audit plans in 2025. For implementation status, please refer to the Sustainable Development Committee in the Investor Relations section on WNC’s official website.
Sustainable development organization

Sustainable Development Committee
Members
Responsibilities
Expertise
- Chairman Haydn Hsieh (Convener)
- President & CEO Jeffrey Gau (Director)
- T. Y. Lay, Rosie Yu (Independent Directors)
- Top-tier managers: General Plant Manager Aaron Hsu, Chief Supply Chain Officer Amy Hsu, Chief Financial Officer & Head of Corporate Governance Jona Song
- Supports the Board of Directors in driving ongoing corporate sustainability efforts and strengthening corporate governance to realize the goal of sustainable development; develops goals based on corporate sustainability directions and strategies, formulates related management policies and implementation plans, and tracks and reviews the execution results
- Meets at least twice a year; additional meetings may be convened as needed
- Sustainable development strategies
- Green R&D and manufacturing
- Sustainable supply chain
- Sustainable finance

Sustainable Development Center
Members
Responsibilities
Expertise
The Chief Sustainability Officer is the highest ranking manager of the center
- Responsible for promoting sustainability and ensuring the effective functioning of the Sustainability Committee. Facilitates communication between the Committee, the Board of Directors, and working groups
- Coordinates and executes tasks related to sustainability disclosures, the advancement of sustainability projects, sustainability think tank development, and the management of the RBA system
- Sustainability think tank
- Sustainable information disclosure
- Sustainability project execution
- RBA management

Sustainability Working Group
Members
Responsibilities
Expertise
Top-tier managers from function units serve as members and select officers
- Three working groups were established under the Sustainable Development Committee to coordinate, implement, and execute projects related to environmental protection, social responsibility, and corporate governance. They serve as a cross-functional platform for addressing the company’s sustainability issues
- Responsible for formulating short-, mid- and long-term sustainability goals and coordinating working groups to implement sustainability initiatives in accordance with WNC’s sustainable development strategies and stakeholder expectations
- Holds quarterly meetings to confirm the progress of ESG projects and review goal progress
- Environmental sustainability
- Social responsibility
- Corporate governance
External Impact Valuation
As part of its double materiality assessment, WNC evaluates the positive and negative impacts its operations, products and supply chain have on the environment and society. With reference to the Value Balancing Alliance (VBA), Harvard Business School's Impact-Weighted Accounts and B4SI, WNC identified 21 external impacts and prioritized them by severity (scale, scope and irremediability) and likelihood. Climate & Energy Management and Sustainable Materials were assessed as the material topics with the highest external impact.
2025 Material issues with external impact
| Material issue | Source of impact | Stakeholders affected | Why it matters to external stakeholders |
|---|---|---|---|
Climate & Energy Management (Scope 1 and 2 GHG emissions) | WNC's own operations (fuel combustion and purchased electricity), covering 100% of global operations. | Environment, society | GHG emissions contribute to climate change and extreme weather, which harm communities, health and ecosystems. Scope 1 and 2 emissions are also a priority for external stakeholders: governments regulate direct and electricity-related emissions and large electricity users, customers require RE100, and WNC's Scope 1 and 2 emissions form part of its customers' Scope 3 emissions. Renewable energy and energy efficiency reduce these impacts. |
| Sustainable Materials | Raw material procurement, WNC's operations and products, covering all plastics used in in-house manufactured components | Environment, consumers/end-users | Procurement of raw materials causes air pollution, waste, water and GHG impacts. Replacing virgin plastics with post-consumer recycled (PCR) plastics reduces fossil resource extraction, plastic waste and the climate damage borne by society, and provides end-users with lower-impact products. |
Impact valuation methodology and results
WNC converts its output metrics into monetary impact metrics using the social cost of carbon (SCC). The SCC represents the monetized damages to society from emitting one additional tonne of CO2, including effects on human health, agricultural productivity, property damage from extreme weather and loss of ecosystem services. WNC applies the central value of USD 190 per tonne of CO2 at a 2% near-term discount rate, from the 2023 U.S. Environmental Protection Agency's Report on the Social Cost of Greenhouse Gases.
22025 impact valuation results
| Material issue | 2025 Indicators | Impact metric: social cost of carbon |
|---|---|---|
| Climate & Energy Management | Scope 1 and 2 emissions reduction from 2022 base year: a reduction of 12,112.49 tCO2e (-19.01%) | Social cost avoided: USD 2.30 million (NTD 75.44 million) |
| Sustainable Materials | Recycled plastics: 28.89% of 4,397 tonnes of plastics used; emissions avoided versus virgin plastics: 3,172 tCO2e | Social cost avoided: USD 0.60 million (NTD 19.76 million) |
Notes:The SCC value is in 2020 U.S. dollars. NTD amounts are converted at USD 1 = NTD 32.781.Emissions data are from the WNC 2025 Sustainability Report. The GHG inventory boundary covers 100% of WNC's global operations.
Annual sustainable development goals
Green initiatives
Empowerment
Trust
Innovation
Growth
| Material topics | Performance indicators | Progress | Disclosed targets | ||||
|---|---|---|---|---|---|---|---|
| 2025 Goals | Results | Goal achievement status | Short-term 2026 | Mid-term 2028 | Long-term 2030 | ||
| Climate and energy management |
Absolute reduction of GHG emissions(Scope 1 + Scope 2)
(Base year:2022) |
-15.75% | -19.01% |

|
-21.00% | -31.50% | -42.00% |
|
Absolute reduction of GHG emissions(Scope 3)
(Base year:2023) |
-7.14% | -7.69% |
|
-10.71% | -17.85% | -25.00% | |
|
RE ratio
(Renewable energies use ratio) |
25% | 34.47% |
|
30% | 40% | 60% | |
|
Cumulative electricity savings rate(%)1 NEW |
New goal | New goal | New goal | 12% | 14% | 16% | |
| Green products | 100% compliance with product hazardous substance regulations and relevant customer and national requirements | 100% | 100% |
|
100% | 100% | 100% |
| Water resource management |
Water withdrawal intensity reduction2
(Base year:2022) |
-13% | -22.71% |
|
-13% | -13% | -18% |
| Waste management |
Waste conversion rate(%)3 NEW |
New goal | New goal | New goal | 93% | 94% | 95% |
|
Reduction in waste generation intensity
(Base year:2021) |
-50% | -56.57% |
|
50% | 53% | 56% | |
| Sustainable materials | Percentage by weight of recycled plastics used in routers | 35% | 39.4% |
|
40% | 50% | 60% |
Note The former Carbon Sink and Carbon Sequestration Accumulation and Taiwan Native Species Database management targets fall under biodiversity sustainability topics and were not included in material topics; they have therefore been converted into internal management targets. Due to internal requirements, “low carbon materials selection mechanisms” have been integrated into internal action items.
Note1 In consideration of production capacity fluctuations and energy management optimization, the original target of “reducing electricity intensity compared to the previous year” has been revised to “cumulative electricity-saving rate (%)”. The scope of the cumulative electricity-saving rate, water resource, and waste management targets covers major production sites in Taiwan, China, and Vietnam. The Mexico site is still in the build-up phase and will be gradually incorporated into the management scope.
Note2 Water withdrawal intensity is calculated based on numbers from major production sites, and does not include the Mexico site and on-site dormitories. The formula is: Water withdrawal volume (cubic meters) / revenue (NT$ million).
Note3 As major production sites in Taiwan, China, and Vietnam have adopted UL 2799 Zero Waste to Landfill certification, the original “waste recycling rate” target has been revised to “waste conversion rate” to align more precisely with international standards.
| Material topics | Performance indicators | Progress | Disclosed targets | ||||
|---|---|---|---|---|---|---|---|
| 2025 Goals | Results | Goal achievement status | Short-term 2026 | Mid-term 2028 | Long-term 2030 | ||
| Talent recruitment and retention | Turnover rate of Taiwan IDL employees | 12-15% | 11.9% |
|
12-15% | 12-15% | 11-15% |
| Talent development and training | Global average training hours per employee | ≥ 35 hrs | 31.84 hrs | - | ≥ 35 hrs | ≥40 hrs | ≥40 hrs |
| Inclusive workplace | Percentage of employees who feel safe at work | ≥ 85% | 90.87% |
|
≥ 85% | ≥ 85% | ≥ 85% |
| Percentage of women serving as supervisors globally | ≥ 25% | 28.91% |
|
≥ 25% | ≥ 25% | ≥ 25% | |
| Taiwan childcare leave/cash equivalent use rate | 100% | 100% |
|
100% | 100% | 100% | |
| Occupational safety and health | Number of major occupational accidents | 0 | 0 |
|
0 | 0 | 0 |
| Injury rate per 1,000 employees | < 2.0 | 1.316 |
|
< 2.0 | < 2.0 | < 2.0 | |
| Cases of occupational disease caused by chemical exposure | 0 | 0 |
|
0 | 0 | 0 | |
| Number of Taiwan employees with moderate to severe health abnormalities requiring follow-up | ≥ 80% | 100% |
|
≥ 80% | ≥ 80% | ≥ 80% | |
| Taiwan employees influenza vaccination rate | ≥ 85% | 108.1% |
|
≥ 85% | ≥ 85% | ≥ 85% | |
| Community involvement and social welfare | Volunteer participation(no. of instances) | ≥ 325 participations | 386 participations |
|
≥ 325 participations | ≥ 350 participations | ≥ 400 participations |
| Volunteer participation | ≥ 1,000 hrs | 1,292 hrs |
|
≥ 1,000 hrs | ≥ 1,100 hrs | ≥ 2,000 hrs | |
| Employee participation to support rural schoolchildren | ≥ 700 participations | 791 participations |
|
≥ 700 participations | ≥ 750 participations | ≥ 800 participations | |
| Instances of rural schoolchildren supported | ≥ 500 participations | 521 participations |
|
≥ 600 participations | ≥ 650 participations | ≥ 700 participations | |
| Material topics | Performance indicators | Progress | Disclosed targets | ||||
|---|---|---|---|---|---|---|---|
| 2025 Goals | Results | Goal achievement status | Short-term 2026 | Mid-term 2028 | Long-term 2030 | ||
|
Ethical management and regulatory compliance
NEW |
No major regulatory violations | 0 | 0 |
|
0 | 0 | 0 |
| Sustainable supply chain management | Supplier sustainability risk assessment Completion rate | ≥ 80% | 94.6% |
|
≥ 85% | 95% | 95%-100% |
| Response rate of suppliers to the Supplier Commitment to Sustainability Declaration | ≥ 96% | 98.4% |
|
≥ 98% | 98%-100% | 98%-100% | |
|
Incorporate ISO 14001 and ISO 45001 requirements into the RVL supplier selection criteria
NEW |
New goal | New goal | New goal | 95% | 95% | 95%-100% | |
| RBA audit completion rate for WNC suppliers | 100% | 118% |
|
100% | 100% | 100% | |
| Information security | Conduct annual information system disaster recovery drills | 100% | 100% |
|
100% | 100% | 100% |
| Material topics | Performance indicators | Progress | Disclosed targets | ||||
|---|---|---|---|---|---|---|---|
| 2025 Goals | Results | Goal achievement status | Short-term 2026 | Mid-term 2028 | Long-term 2030 | ||
| Customer relations management | Customer satisfaction average score | ≥ 90 | 94.74 |
|
≥ 90 | ≥ 90 | ≥ 90 |
| Customer satisfaction survey coverage rate(%) | ≥ 80% | 100% |
|
≥ 80% | ≥ 80% | ≥ 80% | |
| Customer complaint reply rate(%) | 100% | 100% |
|
100% | 100% | 100% | |
| Innovation and R&D | Total number of global patents | ≥ 2,550 | 2,648 |
|
≥ 2,700 | ≥ 2,800 | ≥ 2,900 |
| Material topics | Performance indicators | Progress | Disclosed targets | ||||
|---|---|---|---|---|---|---|---|
| 2025 Goals | Results | Goal achievement status | Short-term 2026 | Mid-term 2028 | Long-term 2030 | ||
| Operational and financial performance | Corporate governance evaluation |
Score 6%–20% above the average of listed companies (average) |
6%-20% |
|
Score 6%–20% above the average of listed companies (average) |
Score 6%–20% above the average of listed companies (average) |
Top 5% |
| Average attendance rate of Board of Directors’ meetings(%) | ≥ 90% | 100% |
|
≥ 90% | ≥ 90% | ≥ 90% | |
| Number of hours of continuing education for each board member | ≥ 6 hrs | 7.66 hrs |
|
≥ 6 hrs | ≥ 6 hrs | ≥ 6 hrs | |